How to tell the difference between a reversal and a correction on a price chart
For anyone who’s looked at a trading chart and asked, «Is this a real trend change or just a dip?», you’re not alone. One of the biggest challenges traders face — from beginners to seasoned pros — is learning to distinguish between a reversal and a correction. Making the wrong call can mean entering too early, exiting too late, or simply getting whipsawed by short-term noise.
The core difference

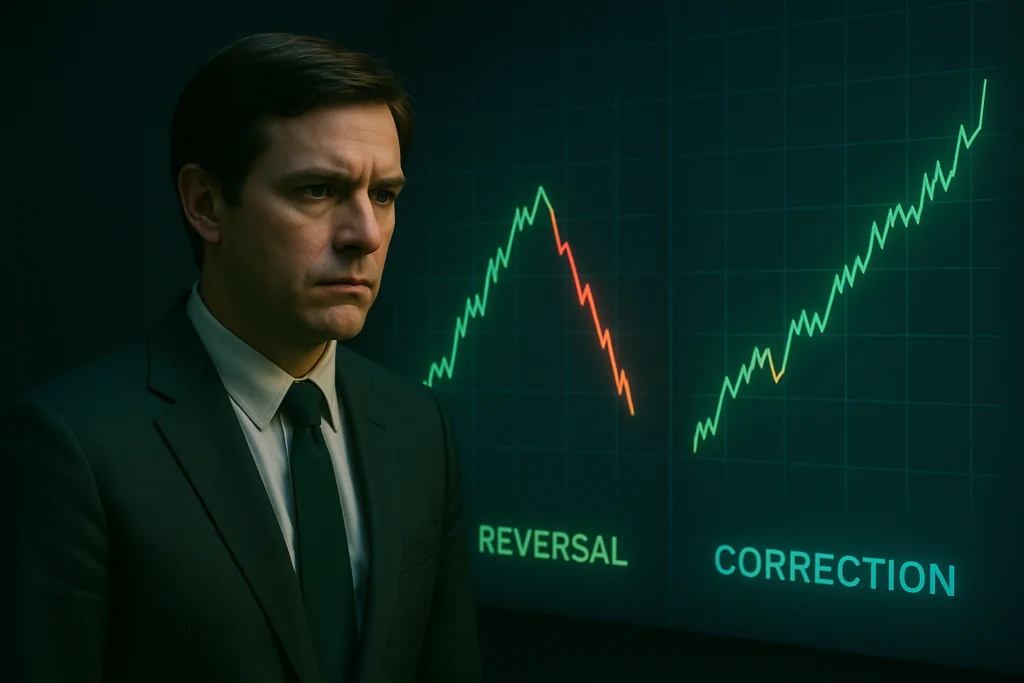
Let’s start with definitions. A correction is a temporary pullback in price that happens within an existing trend. It’s like a market “taking a breath” before continuing its original direction. A reversal, on the other hand, is when the trend changes direction altogether — up becomes down or vice versa.
For example, if the S&P 500 has been climbing for weeks and then drops 3% over a couple of days before resuming its upward march, that’s a correction. But if the index breaks key support levels and continues falling for days or weeks, we might be looking at a trend reversal.
Understanding the difference is important because your actions as a trader should be completely different in each scenario. In a correction, you might look for buying opportunities. In a reversal, you may need to cut losses or reverse your position.
Context is everything

To identify a correction or reversal, you have to consider the bigger picture. That means looking beyond the current day’s chart and zooming out to the larger timeframes. A five-minute pullback may look dramatic on a 1-minute chart but could be irrelevant on a daily chart.
Volume also matters. Corrections often happen on lower volume compared to reversals, which are typically accompanied by a spike in trading activity. This increase in volume can signal a shift in sentiment — from bullish to bearish or vice versa.
Another important factor is news or fundamental catalysts. A small price drop on no news is more likely a correction. But if a major company reports a sharp drop in earnings or a central bank unexpectedly raises rates, a reversal may be underway.
Clues that suggest a correction
Corrections are natural and healthy in trending markets. They can happen after a strong move when buyers or sellers pause to take profits.
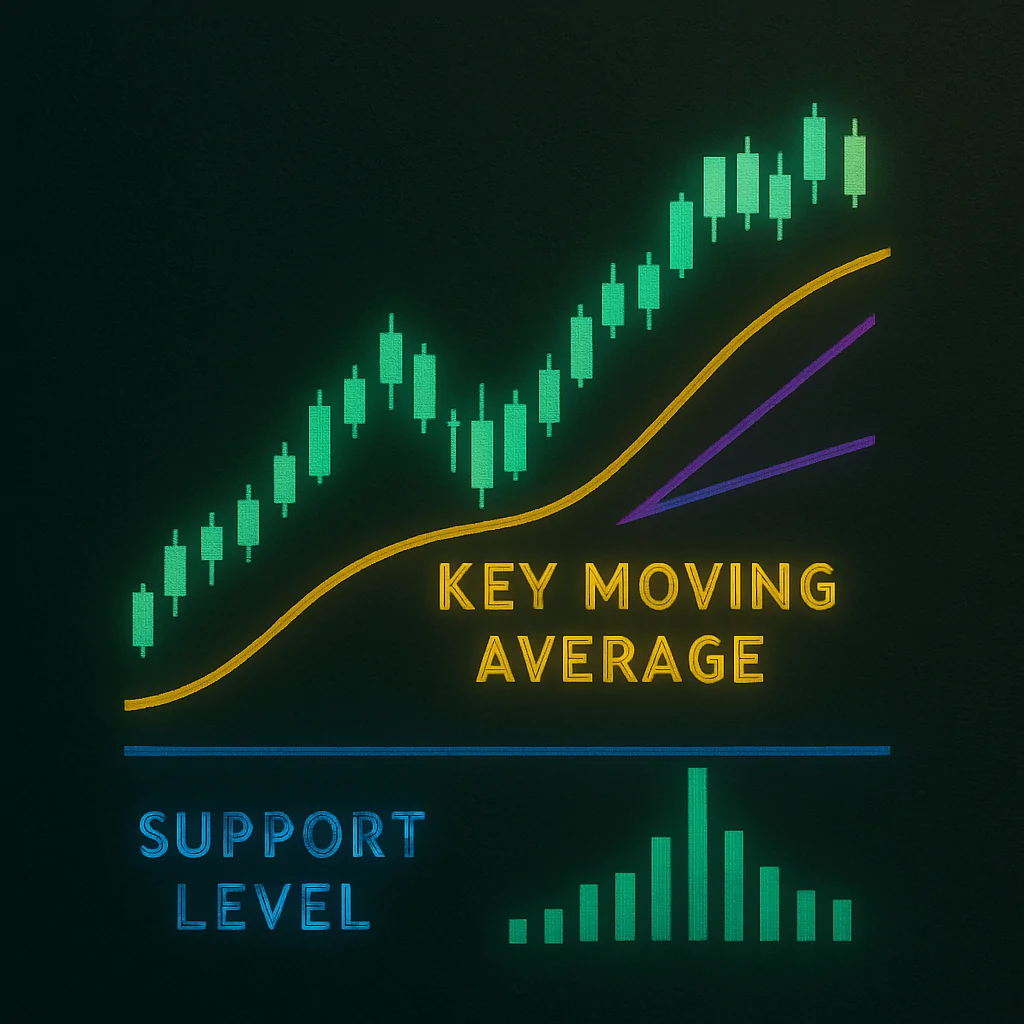
Here are some signs you’re likely seeing a correction rather than a reversal:
- The price stays above key moving averages (like the 50-day or 200-day)
- There is no major change in volume or momentum
- The structure of higher highs and higher lows (in an uptrend) remains intact
- The pullback is relatively shallow (under 10%)
- Support levels hold without much struggle
Even with these signs, patience is key. Wait to see if the price rebounds in the direction of the original trend before making a decision.
When it might be a reversal
Reversals tend to come with stronger signals — and often stronger emotions. They can mark the end of a trend and the beginning of a new one. Missing or misjudging a reversal can be costly, especially if you’re still trading in the old direction.
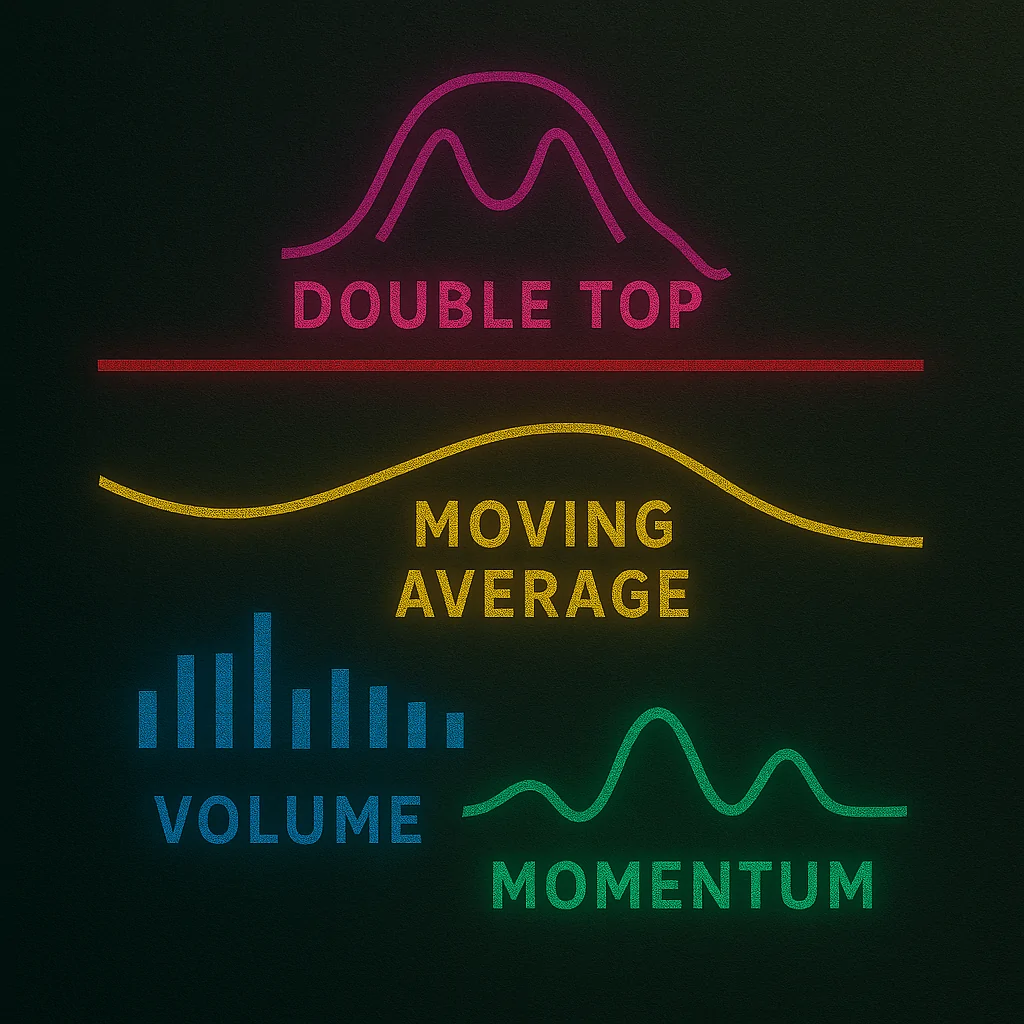
Things to look for when identifying a reversal include:
- The price breaks through key support or resistance levels
- Volume increases significantly during the move
- The asset forms a new pattern, like a double top or head and shoulders
- Moving averages begin to cross over in the opposite direction
- Momentum indicators (like RSI or MACD) diverge from the price trend
Paying attention to these signs — especially when they appear together — can give you a more confident read on what the market is really doing.
Conclusion
Telling the difference between a correction and a reversal is one of the most useful skills any trader can develop. While there’s no foolproof formula, combining technical tools, price structure, volume, and market context gives you a serious edge. Over time, patterns become clearer, and your ability to act with confidence improves.
The markets will always have noise, and short-term moves can be deceiving. But traders who step back, stay patient, and avoid impulsive decisions tend to make better long-term choices. Whether you’re buying the dip or stepping aside during a reversal, knowing what you’re looking at is half the battle — and often the difference between consistent growth and repeated mistakes.